

Big 3 state-owned banks: equal profits, vastly different risk buffers
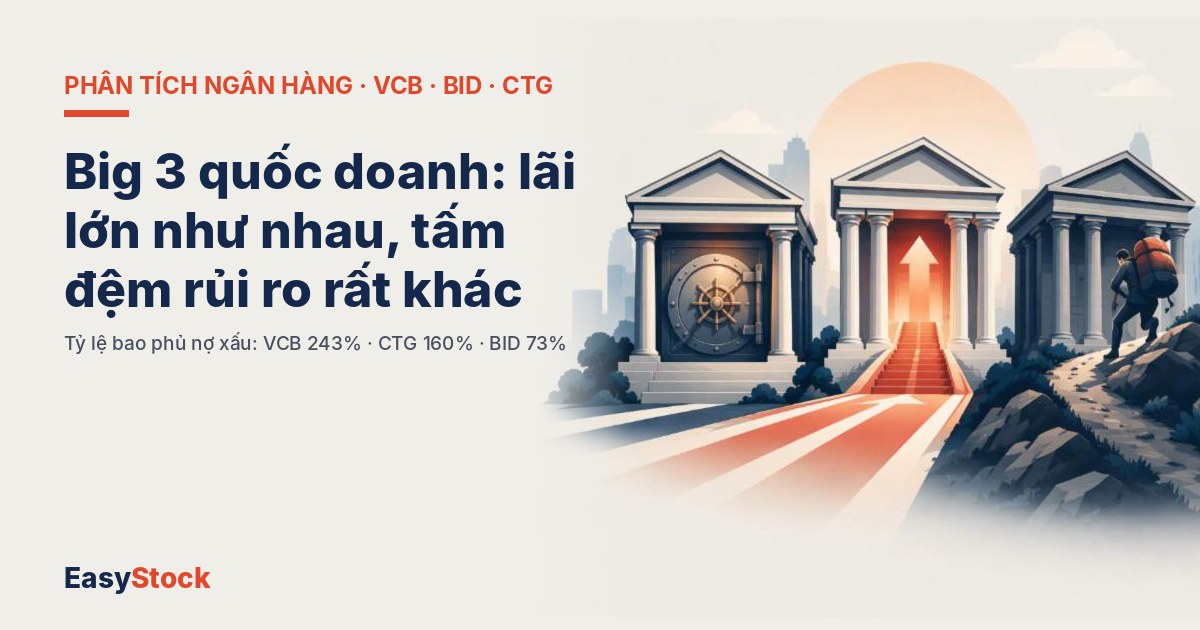
After 9 months of 2026, Vietcombank, VietinBank, and BIDV combined generated nearly 110,000 billion VND in pre-tax profit, crossing the 100,000 billion mark for the first time. Yet this aggregate figure masks a question every bank investor should ask: has this profit “paid sufficient insurance premiums” against risks?
The answer from the three banks differs to the point of being nearly opposite. One deliberately took a flat quarter to thicken its buffer. One accelerated growth while maintaining a high buffer. The third achieved the strongest quarterly profit gain, largely because reduced provisions coincided with rising NPLs.
NPL Coverage: 243%
P/B 1.77x · P/E 10.8x
NPL Coverage: 160%
P/B 1.19x · P/E 5.75x
NPL Coverage: 73.4%
P/B 1.26x · P/E 7.04x
Q3 saw a leadership change few noticed
VietinBank’s pre-tax profit in Q3 was around 13,689 billion VND, up 29%, surpassing Vietcombank (11,218 billion) to lead the entire sector in the quarter. Over 9 months, CTG trails VCB by only about 883 billion VND—less than one week’s profit for CTG at Q3 pace.
But careful reading reveals VCB didn’t slow because of weaker operations. VCB’s pre-provision profit in Q3 still grew around 45%. What held back net profit was a 6,184 billion VND provision charge in the quarter.
Vietcombank chose to pay insurance early
Over 9 months, VCB allocated 9,180 billion VND to credit risk provisions—nearly 4 times the prior year period, with about two-thirds coming in Q3. Analysts largely tie this to risks from a corporate bond position. NPLs also rose: 12,818 billion VND, up 32% from year-start; NPL ratio increased from 0.58% to 0.71%.
Notably, even after all this, VCB’s coverage ratio remained at 243%, meaning the provision fund of approximately 31,168 billion covers nearly 2.5 times total current NPLs. VCB has achieved about 87% of its annual profit target of 46,221 billion. At a P/B of 1.77x—the highest in the group—the market is explicitly paying a premium for this sense of security.
BIDV: Profit up 39%, but examine the provision line
In Q3, BIDV reported pre-tax profit around 10,600 billion VND, up about 39% year-over-year. Net interest income rose 12.4%, meaning profit growth substantially outpaced core business activity. The missing piece: provision expenses in Q3 were around 6,640 billion, down 25%.
Lower provisions would be reasonable if NPLs were shrinking. At BIDV, it’s the opposite. NPLs at end-Q3 totaled around 47,486 billion VND, the largest among the three; notably, Group 3 NPLs alone rose to 13,047 billion, nearly triple year-start. The provision fund barely budged at 34,871 billion, so coverage ratio fell from near 100% at end-2025 to 73.4%, roughly matching the 74% average of 27 listed banks.
A simple calculation
To raise coverage ratio back to 100%, BIDV would need approximately 12,600 billion VND additional provisions (47,486 – 34,871). This figure equals about 43% of 9-month pre-tax profit. This is not a forecast that BIDV will provision at this level, but rather a gauge of how heavy the load on its shoulders really is.
Meanwhile, BIDV’s 9-month lending grew only 8.1%, below the 11.6% system-wide pace, and NIM over 9 months at about 2.01% is the lowest in the group. On the bright side, capital is being reinforced: charter capital rose from 72,801 to 77,782 billion during Q3, while shareholders’ equity reached about 203,020 billion VND.
VietinBank: cheapest in the group, but not for lack of strength
CTG presents the toughest valuation puzzle. Its 9-month pre-tax profit grew 33.9%, the fastest in the group. NPL ratio around 1.2%, coverage at 160% with provision fund about 41,353 billion—largest among the three in absolute terms. Yet CTG trades at P/E around 5.75x, nearly half of VCB’s.
This discount reflects two market concerns: whether high growth rates can persist as NIM approaches VCB levels, and whether rising NPL pressure across the sector might eventually reach CTG. If both concerns prove unfounded, CTG may be the bank with the largest gap between business results and market price.
Placing three banks on the same board
| Metric | VCB | CTG | BID |
|---|---|---|---|
| Profitability | |||
| Pre-tax Profit 9M/2026 (billion VND) | 40,440 | 39,557 | 29,484 |
| Growth vs. prior year | +22.1% | +33.9% | +24.8% |
| Pre-tax Profit Q3/2026 (billion VND) | 11,218 | 13,689 | ~10,600 |
| Asset Quality (30/9/2026) | |||
| NPLs (billion VND) | 12,818 | 25,781 | 47,486 |
| NPL Ratio | 0.71% | 1.2% | 1.85% |
| NPL Coverage Ratio | 243% | 160% | 73.4% |
| Efficiency & Funding (Q3, FiinX) | |||
| NIM Q3 | 2.87% | 2.81% | 2.08% |
| CASA Ratio | 31.8% | 22.7% | 19.9% |
| Valuation (13/11/2026 close, FiinX) | |||
| Closing Price (VND) | 53,800 | 31,500 | 31,850 |
| P/E TTM | 10.79 | 5.75 | 7.04 |
| P/B TTM | 1.77 | 1.19 | 1.26 |
| % Change since year-start | -5.7% | -10.5% | -11.5% |
| State Ownership | 74.8% | 64.5% | 76.7% |
NIM and CASA per FiinX methodology for Q3 only, may differ from bank-published figures (typically on cumulative basis). NPL and provision balances per consolidated financial statements for Q3/2026.
Three metrics to watch in Q4
- Will BIDV’s provision levels rise again? If Group 3 NPLs continue migrating to heavier categories, the low provisions of Q3 will be hard to sustain, pressuring profit growth.
- Will VCB’s provision expenses normalize? If most of Q3’s charge was one-time, the strong pre-provision profit growth should show through more clearly in later quarters.
- Can CTG maintain NIM and NPL levels? These two factors are key to whether the market narrows its valuation discount.
All three banks share state-owned “DNA,” yet careful reading of Q3 reports shows they occupy very different positions on the safety–growth–valuation spectrum. This is a way to categorize by financial characteristics so investors can align with their own preferences, not a ranking or recommendation.
Data Sources: FiinX (prices, P/E, P/B, NIM, CASA, coverage ratios, state ownership); consolidated financial statements Q3/2026 for VCB, CTG, BID and their public disclosures; banking sector aggregate data Q3/2026 from financial press. BIDV’s additional provision need calculated by Easy Stock from NPL and provision balances.
This article synthesizes information from public sources and independent financial analysis. Content is for informational reference only and does not constitute investment advice under the 2019 Securities Law. Investors bear full responsibility for their financial decisions. EasyStock — easystock.vn
