


Top 5 securities companies Q3/2026: leading market share doesn’t guarantee the highest profit
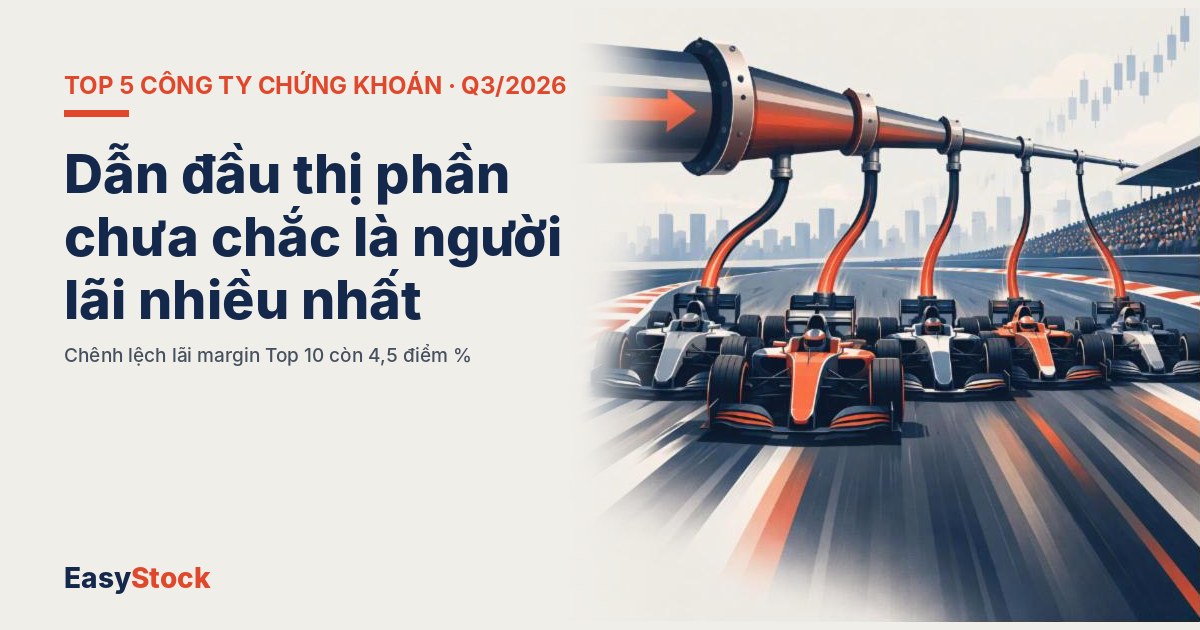
The five largest securities companies are splitting 46.56% of HOSE brokerage market share in Q3/2026. But if ranked by profit, the standings flip completely. Market share tells who has the most clients; profit reveals who knows how to make money from clients and capital.
RANKED BY HOSE MARKET SHARE Q3
- VCK 11.54%
- SSI 11.09%
- TCX 10.03%
- VCI 7.80%
- HCM 6.10%
RANKED BY Q3 PROFIT
- TCX 2.152 trillion Pre-tax Profit
- SSI ~1.388 trillion Pre-tax Profit
- VCK 1.119 trillion Pre-tax Profit
- VCI 427 billion Pre-tax Profit
- HCM 297 billion After-tax Profit
VCK, ranked number one in market share, places only third in profit. TCX, third in market share, generates the most profit and is the only company in the group to set a record. The reason lies in Q3 itself: brokerage earnings are nearly dried up, with average trading value across three exchanges at only around 18,600 billion VND per session, down 58% year-on-year.
The industry’s common pipeline is narrowing
When brokerage dries up, the entire industry turns to margin lending. Total loan outstanding across the industry, including advances, reached 459,955 billion VND by end of September, the highest on record. Net interest income from margin in Q3 for 81 companies rose to 12,843 billion VND, up 37.1%. It sounds like a boom quarter, until you look at the cost side.
Lending yield remained essentially flat while cost of funds rose nearly 2 percentage points. Total interest expense for the industry in Q3 reached 9,081 billion VND, up 44.8%, outpacing the growth rate of margin income. Therefore, the question for each company is no longer “how much can we lend”, but “how much do we retain from each VND lent”.
Five companies, five survival strategies in a tight liquidity quarter
Loan and advance outstanding of 54,740 billion VND, the largest in the industry, represents only about 1.15 times equity. Net income from this segment totaled 1,548 billion VND, accounting for about 44% of operating income; pre-tax profit for the quarter hit a record 2,152 billion VND. The flip side: increased net financial costs have “eaten” nearly 80% of the incremental income growth in the quarter. TCX is growing more through volume than through margin expansion.
Pre-tax profit in Q3 around 1,388 billion VND, down about 24%, primarily because brokerage revenue on standalone basis fell from around 922 billion to 350 billion. Margin income of 1,115 billion VND still grew 11%, but loan outstanding declined from 40,473 billion to 38,294 billion and the interest rate spread around 4.9 percentage points. Nine-month profit still reached 4,510 billion VND, up 11%.
Pre-tax profit in Q3 reached 1,119 billion VND, down 19.8%; operating revenue down 23.3%. Lending income nearly 948 billion VND, up 34% and nearly double brokerage revenue of 485 billion. Notable point: VCK has the highest lending yield in Top 10, around 13.3% per annum, while brokerage market share fell over 1 percentage point versus Q2 and has retreated far from the 15.95% level of full-year 2025. Nine-month profit still 4,044 billion VND, up 26.7%, reaching 70.3% of target.
Vietcap increased market share most strongly in the group, adding 0.8 percentage points to 7.80%, and advisory and guarantee fee revenue at 131 billion is the highest in six quarters. But interest expense nearly doubled, average borrowing rate rose to 6.9%, pulling interest margin spread down to around 4.0 percentage points. Pre-tax profit in Q3 reached 427 billion VND, down 17.8%; nine-month achievement only 47.9% of 2,300 billion VND target. Large AFS portfolio caused equity decline despite quarterly profit.
Loan outstanding around 29,170 billion VND, equivalent to about 2 times equity of 14,505 billion VND, meaning virtually no room to spare under regulations. Margin income of 758 billion accounts for over 60% of operating revenue, but HCM’s lending yield ranks among the lowest in Top 10, around 10.4% per annum. Brokerage revenue down about 70% to 152 billion; after-tax profit in Q3 down nearly 33% to 297 billion.
Side by side: return on equity and valuation
| Code | Q3 Market Share (Δ q/q) | Loans/Equity | ROE Q3 | P/E | P/B | % YTD |
|---|---|---|---|---|---|---|
| VCK | 11.54% (-1.07) | – | 13.9% | 15.53 | 2.09 | -12.2% |
| SSI | 11.09% (-0.08) | ~97% | 11.8% | 13.00 | 1.55 | -16.5% |
| TCX | 10.03% (+0.67) | ~115% | 13.6% | 15.17 | 1.99 | -12.2% |
| VCI | 7.80% (+0.80) | ~102% | 8.1% | 15.73 | 1.34 | -23.2% |
| HCM | 6.10% (-0.70) | ~201% | 8.1% | 21.69 | 1.81 | +20.8% |
Market share: HOSE. ROE, P/E, P/B, % price: FiinX (Q3/2026 ROE; TTM valuation as of November 13, 2026). Loans/Equity: Easy Stock calculated from loan outstanding end of Q3 and consolidated equity (FiinX). “–”: comparable loan outstanding data not available.
The most striking paradox in this table
HCM has the group’s lowest ROE, outstanding loans already at the ceiling, lowest lending yield, and Q3 profit down by a third. Yet it’s the only stock to gain price year-to-date, with the highest P/E. The market is clearly valuing HCM on a different story beyond current operating results. Investors should determine for themselves what that story is before comparing HCM using the numbers in this table.
What will reshape the rankings in Q4?
The biggest variable is cost of funds. TCBS assesses that cost of funds for securities companies could decline gradually from Q4 as deposit interest rates cool. If that happens, companies with heavy short-term borrowing and thin margins like VCI will be the most “liberated”. Conversely, if liquidity returns sooner, SSI and VCK, the two companies with the largest brokerage revenue scale, will be the direct beneficiaries.
For now, Q3’s lesson is quite clear: in the securities race, market share is the customer walking through the door; net interest margin spread is the money staying in the vault.
Data sources: HOSE (brokerage market share Q2, Q3/2026 and 2025); operating results and financial statements Q3/2026 of VCK, SSI, TCX, VCI, HCM; FiinX (ROE, equity, P/E, P/B, price movement); Q3/2026 securities industry report from TCBS and FiinTrade data compiled by media.
This article is a compilation from public information sources and independent financial analysis. Content is for reference purposes only, not investment recommendations under the Securities Law 2019. Investors bear sole responsibility for their financial decisions. EasyStock — easystock.vn
