

Market Pulse before opening
Domestic Macro
International Macro
Wall Street: Wall Street declined on 14/10 following hotter-than-expected inflation report: Dow down 0.09% to 51,621.48 points; S&P 500 down 1.11% to 7,718.94 points; Nasdaq down 1.88% to 26,692.87 points; Russell 2000 down 1.93%. Tech group down 3%, VIX volatility index up 10% to 16.82. Nikkei 225 down 3.39% to 65,450.69 points, Hang Seng 24,314.17 points.
Crude Oil: Oil prices rebounded in the session due to Iran-related conflict attacks: WTI around 95 USD/barrel, Brent around 106-108 USD/barrel (official settlement prices not yet available). Rising gasoline prices were also a key driver pushing US headline CPI upward.
Fed Policy: US September CPI rose 0.6% month-over-month and 3.7% year-over-year (forecast 3.6%); core CPI rose 0.3% and 2.6%, both exceeding expectations. Market concerns about Fed rate hike at end-October meeting; 10-year bond yield rose over 6 basis points to 5.278%. Domestically, central rate increased 13 VND to an all-time high of 25,646 VND/USD.
Large Money Flow: Foreign net outflow -773 billion VND, concentrated in VIC (around 153 billion), VHM (around 152 billion), FRT (around 94 billion); net inflow into MBB (over 100 billion), STB (around 44 billion), HPG (around 29 billion). Proprietary strong net inflow +426 billion VND; last 10 sessions proprietary bought HDB/VPB/FRT, sold TCB/CTG/MCH. Real estate declined most (-2.04%), materials among few gainers (+0.29%).
Notable Enterprises / Sectors
VHM, VIC & VPL
Risk- VHM down 5.28% to 61,000 VND (volume 1.28x), breaking below MA200 (64,740); VIC down 1.62% to 218,400 VND; VPL down 3.31% to 76,000 VND, below MA50 (79,380).
- Foreign net outflow from VIC around 153 billion and VHM around 152 billion VND – two pillars accounting for nearly 40% of total session outflow; VPL in internal portfolio “risk signal” group.
STEEL: HSG & NKG
Positive- HSG up 4.48% to 10,500 VND (volume 2.75x), NKG up 6.82% to 10,500 VND (3.00x) – both breaking above MA50 (HSG 10,420, NKG 10,350).
- Both codes entering internal portfolio “new positive stocks” group; materials sector among few gainers, HPG also received foreign net inflow around 29 billion VND.
F88
Positive- F88 up 10.31% to 57,800 VND with volume 2.42x – one of strongest gainers amid red market session.
- Code just entered internal portfolio “new positive stocks” group but price still below MA50 (59,760) and MA200 (71,520), needs MA50 breakout to confirm trend.
MBB
Positive- MBB up 1.57% to 19,350 VND (volume 1.43x) and strongest foreign net inflow recipient this session (over 100 billion VND).
- Price still below MA50 (20,000) and MA200 (20,560), so this is a technical bounce; foreign capital returning to large bank is rare bright spot.
FPT
Neutral- FPT up 1.42% to 57,100 VND (volume 1.20x), counter-trend after long decline and limiting tech sector losses.
- Note US tech group just fell 3% after hot CPI; FPT still deep below MA50 (63,910) and MA200 (70,460), so bounce lacks confirmation basis.
NVB & FRT
Risk- NVB down 6.04% to 14,000 VND (volume 1.51x) – second consecutive decline after previous limit down, in internal portfolio “risk signal” group.
- FRT down 2.23% to 140,600 VND, just broke below MA50 (140,960) and faced foreign net outflow around 94 billion VND.
Trading Scenario (Wyckoff + Minervini SEPA)
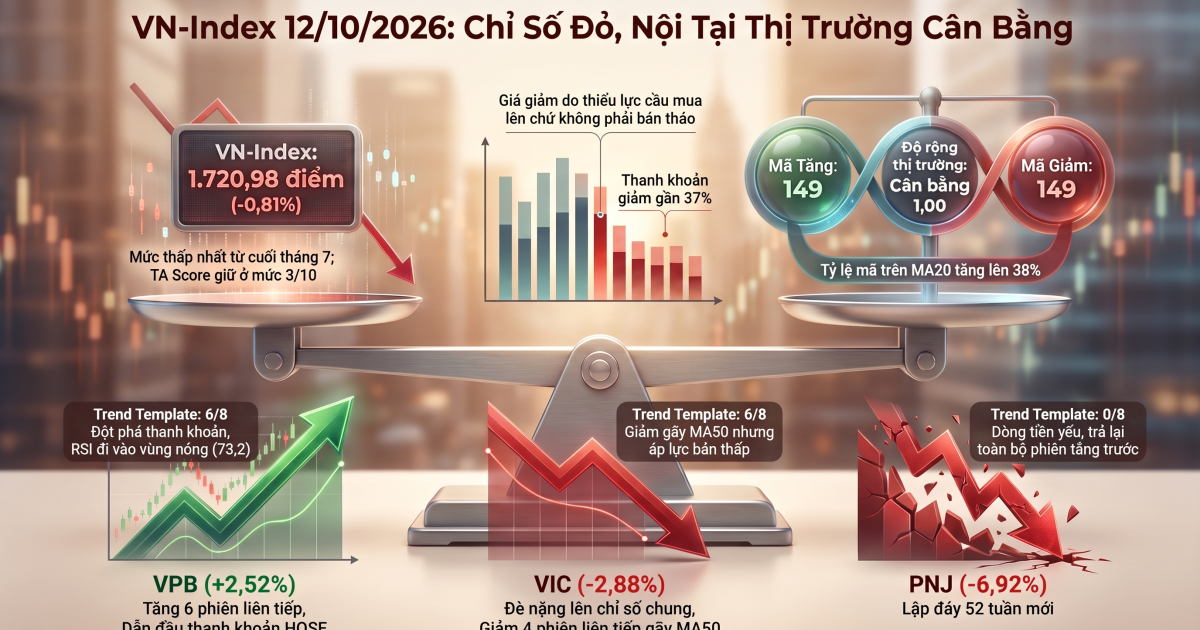
TECHNICAL BASIS: VN-Index broke below 1,711-1,720 zone validated previous day, session low 1,700.74 and close 1,704.87 – sixth consecutive decline. Session 13/10 test not confirmed, but volume continues thin: 446.4 million shares (0.85x 20-session average), third consecutive session below average – price falling due to lack of demand rather than panic selling. Near support is 1,701-1,705 base end-July; strong support is 22-28/07 low (1,651.20-1,669.01). RSI 30.67 approaching 30 threshold; index below MA50 (1,779.02), MA150 (1,791.34), MA200 (1,797.85) – Stage 4.
STRATEGY: Maintain defensive posture, keep cash allocation high; ATO session prioritize observation since Wall Street just declined sharply after hot CPI. No bottom fishing without signals: only consider probe disbursement at reduced allocation when VN-Index closes above 1,723 with volume above 20-session average (around 523 million shares), prioritizing steel group just above MA50. If close below 1,700 with volume spike above 600 million shares, reduce allocation; 1,651-1,670 zone is monitoring point for selling climax/spring signals.
Corporate Event Calendar
Today (Trading Registration 15/10/2026)
| Code | Exchange | Event | Ratio | Implementation Date |
|---|---|---|---|---|
| NNT | UPCoM | Stock issuance | 162.50% | 15/10/2026 |
| TV4 | HNX | Cash dividend | 10.00% | 22/10/2026 |
| CFV | UPCoM | Cash dividend | 10.00% | 22/10/2026 |
| DWC | UPCoM | Cash dividend | 8.00% | 22/10/2026 |
| MQB | UPCoM | Cash dividend | 4.00% | 27/10/2026 |
Next Week (large cap codes / notable ratios)
| Code | Exchange | Event | Ratio | Trading Registration Date |
|---|---|---|---|---|
| BED | HNX | Cash dividend | 40.00% | 16/10 |
| CNG | HOSE | Cash dividend | 10.00% | 16/10 |
| SBA | HOSE | Stock issuance | 5.00% | 16/10 |
| SSC | HOSE | Cash dividend | 10.00% | 19/10 |
| TLD | HOSE | Stock issuance | 5.00% | 19/10 |
| CTP | HNX | Stock issuance | 20.00% | 20/10 |
| TCT | HOSE | Cash dividend | 5.00% | 20/10 |
| TMG | UPCoM | Cash dividend | 30.00% | 21/10 |
| HPT | UPCoM | Stock issuance | 15.00% | 21/10 |
| SBH | UPCoM | Cash dividend | 15.00% | 21/10 |
Stock Signal Tracking
STOCKS WITH POSITION GAIN SIGNALS
STOCKS WITH RISK SIGNALS
Stock Tracking List by VSA/Wyckoff Method
| Code | Trend | Price | Support | Resistance | Assessment (Reference) |
|---|---|---|---|---|---|
| ANV | Up* | N/A | N/A | N/A | Session shows price push-up effort: if at early uptrend phase, positive signal; if at peak zone could be final boost before distribution; cautious and wait confirmation. |
| BAF | Down* | 31.15 | 30.68 | 33.00 | Buying pressure returns after long decline, reversal to new uptrend possible; needs further confirmation. |
| CEO | Down** | N/A | N/A | 12.68 | Previous session successfully tested supply; price rise with volume confirms uptrend continuation, consider increasing position. |
| CLI | Up** | N/A | 26.79 | 29.66 | Strong buying pressure, price clearly pushing higher. |
| CMG | Down* | 19.15 | 19.00 | 22.82 | Large money flow absorbing supply, showing optimistic price view; downtrend may reverse soon. |
| CSV | Up* | N/A | 22.36 | 24.29 | No updated assessment from sources at compilation time. |
| DBC | Down** | 15.35 | N/A | N/A | Buying pressure returns after long decline, reversal to new uptrend possible; needs further confirmation. |
| DDV | Up | N/A | N/A | 19.28 | Session shows price push-up effort: if at early uptrend phase, positive signal; if at peak zone could be final boost before distribution; cautious and wait confirmation. |
| DPG | Up | N/A | N/A | 32.99 | Sharp decline appears right after false rally, confirms weak stock; cautious to avoid unfavorable positions. |
| DRC | Down* | 9.85 | 9.65 | 10.86 | Buying pressure returns after long decline, reversal to new uptrend possible; needs further confirmation. |
| DXP | Up** | N/A | 13.97 | 14.93 | False rally signal: price spikes then reverses quickly, creating illusion of strength; cautious to avoid FOMO. |
| F88 | Up | 57.80 | 45.00 | 64.10 | Session shows price push-up effort: if at early uptrend phase, positive signal; if at peak zone could be final boost before distribution; cautious and wait confirmation. |
| FPT | Down** | 57.10 | 55.80 | 61.48 | Buying pressure returns after decline, downtrend likely to reverse soon; wait additional confirmation session. |
| FTS | Down** | 18.00 | 17.25 | 21.55 | Buying pressure returns after decline, downtrend likely to reverse soon; wait additional confirmation session. |
| G36 | Up** | N/A | N/A | 9.24 | Buying pressure returns after long decline, reversal to new uptrend possible; needs further confirmation. |
| GEG | Down** | N/A | N/A | 12.66 | Buying pressure returns after decline, downtrend likely to reverse soon; wait additional confirmation session. |
| GMD | Up | 53.00 | 51.67 | 56.00 | Previous session successfully tested supply; price rise with volume confirms uptrend continuation, consider increasing position. |
| HAG | Up | N/A | 13.25 | 14.59 | Stock testing remaining supply on market; wait for session result confirmation. |
| HAH | Down | 48.35 | 47.98 | 51.12 | Stock testing remaining supply on market; wait for session result confirmation. |
| HDA | Up** | N/A | 8.43 | N/A | Sharp decline appears right after false rally, confirms weak stock; cautious to avoid unfavorable positions. |
| HDG | Down** | N/A | 14.15 | 18.47 | Weak buying pressure, uptrend unlikely to recover in short term. |
| HVH | Down* | 10.25 | N/A | 10.33 | Stock testing remaining supply on market; wait for session result confirmation. |
| KLB | Down* | 10.95 | 10.55 | 11.68 | Very low supply pressure, large money flow could easily push price higher; should wait several sessions confirmation before action. |
| LAS | Up | 12.00 | N/A | N/A | Session shows price push-up effort: if at early uptrend phase, positive signal; if at peak zone could be final boost before distribution; cautious and wait confirmation. |
| MSN | Up | 71.70 | 69.61 | 74.49 | Stock testing remaining supply on market; wait for session result confirmation. |
| MST | Down* | N/A | 8.66 | 9.44 | Buying pressure returns after long decline, reversal to new uptrend possible; needs further confirmation. |
| MZG | Down* | 11.65 | 11.14 | 11.76 | Stock testing remaining supply on market; wait for session result confirmation. |
| NAB | Down* | N/A | 11.95 | 12.55 | Very strong buying pressure in session, pushing price up and holding near high at close, with large volume – active money participation. |
| NAF | Down | 47.95 | 46.73 | 49.47 | Buying pressure returns after decline, downtrend likely to reverse soon; wait additional confirmation session. |
| OIL | Up* | N/A | 10.94 | 13.31 | Stock testing supply; if successful will signal uptrend continuation or launch new rally. |
| PNJ | Down** | 18.65 | 17.25 | 39.92 | Very low supply pressure, large money flow could easily push price higher; should wait several sessions confirmation before action. |
| PSD | Up* | 15.00 | 14.34 | N/A | False rally signal: price spikes then reverses quickly, creating illusion of strength; cautious to avoid FOMO. |
| PTB | Down** | 29.75 | 27.75 | 32.66 | Buying pressure returns after long decline, reversal to new uptrend possible; needs further confirmation. |
| PVT | Up** | N/A | 22.42 | 26.35 | Stock testing remaining supply on market; wait for session result confirmation. |
| QCG | Down** | N/A | 9.15 | N/A | Buying pressure returns after long decline, reversal to new uptrend possible; needs further confirmation. |
| QTP | Down | N/A | N/A | 11.56 | Weak buying pressure, uptrend unlikely to recover in short term. |
| SAB | Down* | 43.00 | 41.92 | 43.93 | Stock testing remaining supply on market; wait for session result confirmation. |
| SHN | Up* | N/A | 6.33 | 8.27 | Very low supply pressure, large money flow could easily push price higher; should wait several sessions confirmation before action. |
| TCH | Down** | N/A | 9.61 | 12.37 | Previous session successfully tested supply; price rise with volume confirms uptrend continuation, consider increasing position. |
| TLD | Down** | 8.23 | N/A | N/A | Session shows price push-up effort: if at early uptrend phase, positive signal; if at peak zone could be final boost before distribution; cautious and wait confirmation. |
| TNG | Up* | N/A | 18.21 | 20.66 | No updated assessment from sources at compilation time. |
| TVN | Up* | N/A | 9.21 | 10.23 | Buying pressure returns after long decline, reversal to new uptrend possible; needs further confirmation. |
| VC3 | Down** | N/A | 22.75 | 23.78 | Possible downtrend end and new uptrend launch; cautious to avoid FOMO. |
| VEA | Up** | 39.50 | 37.20 | 39.80 | Strong buying pressure, price clearly pushing higher. |
| VGC | Up | 43.75 | 41.63 | 46.35 | Strong money participation, uptrend may continue; consider opening or increasing position. |
| VHM | Down* | 61.00 | Finding Bottom | 69.57 | Supply/selling pressure increased sharply, market pushing price down. |
| VJC | Down* | 128.10 | 118.10 | 128.81 | Stock testing supply; if successful will signal uptrend continuation or launch new rally. |
| VRC | Down** | N/A | 11.64 | 12.41 | Price push-up effort unsuccessful; requires additional monitoring. |